Quasi-Random Sequence Generator Comparison
from qmcpy import *

import pandas as pd
pd.options.display.float_format = '{:.2e}'.format

from numpy import *
set_printoptions(threshold=2**10)
set_printoptions(precision=3)

from matplotlib import pyplot as plt
import matplotlib
%matplotlib inline

SMALL_SIZE = 10
MEDIUM_SIZE = 12
BIGGER_SIZE = 14

plt.rc('font', size=BIGGER_SIZE)          # controls default text sizes
plt.rc('axes', titlesize=BIGGER_SIZE)     # fontsize of the axes title
plt.rc('axes', labelsize=BIGGER_SIZE)    # fontsize of the x and y labels
plt.rc('xtick', labelsize=MEDIUM_SIZE)    # fontsize of the tick labels
plt.rc('ytick', labelsize=MEDIUM_SIZE)    # fontsize of the tick labels
plt.rc('legend', fontsize=BIGGER_SIZE)    # legend fontsize
plt.rc('figure', titlesize=BIGGER_SIZE)  # fontsize of the figure title
General Usage
# Unshifted Samples
lattice = Lattice(dimension=2, randomize=False, seed=7)
unshifted_samples = lattice.gen_samples(n_min=2,n_max=8)
print('Shape: %s'%str(unshifted_samples.shape))
print('Samples:\n'+str(unshifted_samples))
Shape: (6, 2)
Samples:
[[0.25  0.75 ]
 [0.75  0.25 ]
 [0.125 0.375]
 [0.625 0.875]
 [0.375 0.125]
 [0.875 0.625]]
# Shifted Samples
lattice = Lattice(dimension=2, randomize=True, seed=7)
shifted_samples = lattice.gen_samples(n_min=4, n_max=8)
print('Shape: %s'%str(shifted_samples.shape))
print('Samples:\n'+str(shifted_samples))
Shape: (4, 2)
Samples:
[[0.169 0.962]
 [0.669 0.462]
 [0.419 0.712]
 [0.919 0.212]]
QMCPy Generator Times Comparison
Compare the speed of low-discrepancy-sequence generators from Python (QMCPy), MATLAB, and R. The following blocks visualize speed comparisons when generating one-dimensional unshifted/unscrambled sequences. Note that the generators are reinitialized before every trial.
# Load AccumulateData
df_py = pd.read_csv('../workouts/lds_sequences/out/python_sequences.csv')
df_py.columns = ['n',
                 'py_n','py_l','py_mps',
                 'py_h_QRNG','py_h_Owen',
                 'py_s_QMCPy','py_s_SciPy']
df_m = pd.read_csv('../workouts/lds_sequences/out/matlab_sequences.csv', header=None)
df_m.columns = ['n', 'm_l', 'm_s','m_h']
df_r = pd.read_csv('../workouts/lds_sequences/out/r_sequences.csv')
df_r.columns = ['n','r_s','r_h','r_k']
df_r.reset_index(drop=True, inplace=True)
def plt_lds_comp(df,name,colors):
    fig,ax = plt.subplots(nrows=1, ncols=1, figsize=(8,5))
    labels = df.columns[1:]
    n = df['N']
    for label,color in zip(labels,colors):
        ax.plot(n, df[label], label=label, color=color)
        ax.set_xscale('log',base=2)
        ax.set_yscale('log',base=10)
    ax.legend(loc='upper left')
    ax.set_xlabel('Sampling Points')
    ax.set_ylabel('Generation Time (Seconds)')
    # Metas and Export
    fig.suptitle('Speed Comparison of %s Generators'%name)
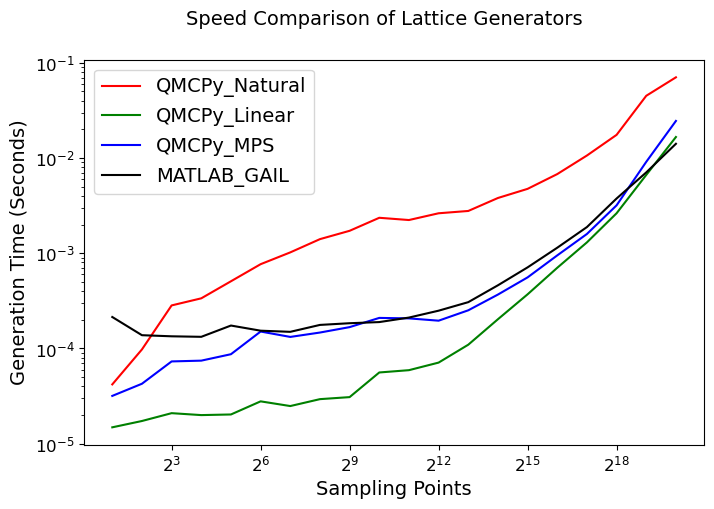
Lattice
df_l = pd.concat([df_py['n'], df_py['py_n'], df_py['py_l'], df_py['py_mps'], df_m['m_l']], axis=1)
df_l.columns = ['N','QMCPy_Natural','QMCPy_Linear','QMCPy_MPS','MATLAB_GAIL']
df_l.set_index('N')
| QMCPy_Natural | QMCPy_Linear | QMCPy_MPS | MATLAB_GAIL | |
|---|---|---|---|---|
| N | ||||
| 2.00e+00 | 4.19e-05 | 1.48e-05 | 3.17e-05 | 2.14e-04 |
| 4.00e+00 | 9.76e-05 | 1.73e-05 | 4.26e-05 | 1.38e-04 |
| 8.00e+00 | 2.83e-04 | 2.09e-05 | 7.30e-05 | 1.34e-04 |
| 1.60e+01 | 3.36e-04 | 1.99e-05 | 7.44e-05 | 1.32e-04 |
| 3.20e+01 | 5.07e-04 | 2.02e-05 | 8.69e-05 | 1.74e-04 |
| 6.40e+01 | 7.67e-04 | 2.78e-05 | 1.50e-04 | 1.54e-04 |
| 1.28e+02 | 1.02e-03 | 2.48e-05 | 1.32e-04 | 1.49e-04 |
| 2.56e+02 | 1.41e-03 | 2.93e-05 | 1.47e-04 | 1.77e-04 |
| 5.12e+02 | 1.72e-03 | 3.08e-05 | 1.67e-04 | 1.84e-04 |
| 1.02e+03 | 2.36e-03 | 5.59e-05 | 2.09e-04 | 1.89e-04 |
| 2.05e+03 | 2.23e-03 | 5.91e-05 | 2.07e-04 | 2.11e-04 |
| 4.10e+03 | 2.63e-03 | 7.10e-05 | 1.96e-04 | 2.49e-04 |
| 8.19e+03 | 2.78e-03 | 1.09e-04 | 2.51e-04 | 3.06e-04 |
| 1.64e+04 | 3.80e-03 | 2.03e-04 | 3.68e-04 | 4.60e-04 |
| 3.28e+04 | 4.74e-03 | 3.70e-04 | 5.57e-04 | 7.10e-04 |
| 6.55e+04 | 6.78e-03 | 7.03e-04 | 9.49e-04 | 1.14e-03 |
| 1.31e+05 | 1.06e-02 | 1.30e-03 | 1.59e-03 | 1.88e-03 |
| 2.62e+05 | 1.75e-02 | 2.63e-03 | 3.18e-03 | 3.76e-03 |
| 5.24e+05 | 4.51e-02 | 6.64e-03 | 9.12e-03 | 7.06e-03 |
| 1.05e+06 | 7.04e-02 | 1.66e-02 | 2.45e-02 | 1.41e-02 |
plt_lds_comp(df_l,'Lattice',colors=['r','g','b','k'])
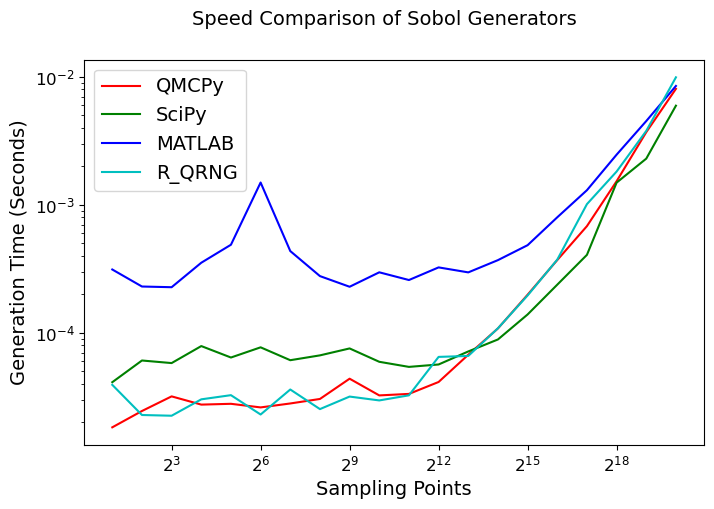
Sobol
df_s = pd.concat([df_py['n'], df_py['py_s_QMCPy'], df_py['py_s_SciPy'], df_m['m_s'], df_r['r_s']], axis=1)
df_s.columns = ['N','QMCPy','SciPy','MATLAB','R_QRNG']
df_s.set_index('N')
| QMCPy | SciPy | MATLAB | R_QRNG | |
|---|---|---|---|---|
| N | ||||
| 2.00e+00 | 1.83e-05 | 4.12e-05 | 3.13e-04 | 3.93e-05 |
| 4.00e+00 | 2.46e-05 | 6.09e-05 | 2.30e-04 | 2.29e-05 |
| 8.00e+00 | 3.20e-05 | 5.82e-05 | 2.28e-04 | 2.26e-05 |
| 1.60e+01 | 2.76e-05 | 7.90e-05 | 3.53e-04 | 3.03e-05 |
| 3.20e+01 | 2.80e-05 | 6.43e-05 | 4.88e-04 | 3.27e-05 |
| 6.40e+01 | 2.62e-05 | 7.72e-05 | 1.50e-03 | 2.31e-05 |
| 1.28e+02 | 2.81e-05 | 6.12e-05 | 4.36e-04 | 3.62e-05 |
| 2.56e+02 | 3.05e-05 | 6.68e-05 | 2.78e-04 | 2.54e-05 |
| 5.12e+02 | 4.39e-05 | 7.57e-05 | 2.29e-04 | 3.18e-05 |
| 1.02e+03 | 3.25e-05 | 5.95e-05 | 2.98e-04 | 2.97e-05 |
| 2.05e+03 | 3.34e-05 | 5.43e-05 | 2.59e-04 | 3.26e-05 |
| 4.10e+03 | 4.14e-05 | 5.67e-05 | 3.25e-04 | 6.50e-05 |
| 8.19e+03 | 6.76e-05 | 7.17e-05 | 2.97e-04 | 6.61e-05 |
| 1.64e+04 | 1.08e-04 | 8.89e-05 | 3.70e-04 | 1.09e-04 |
| 3.28e+04 | 1.99e-04 | 1.39e-04 | 4.84e-04 | 1.96e-04 |
| 6.55e+04 | 3.71e-04 | 2.38e-04 | 8.00e-04 | 3.74e-04 |
| 1.31e+05 | 6.82e-04 | 4.07e-04 | 1.30e-03 | 1.01e-03 |
| 2.62e+05 | 1.53e-03 | 1.49e-03 | 2.47e-03 | 1.82e-03 |
| 5.24e+05 | 3.70e-03 | 2.30e-03 | 4.52e-03 | 3.78e-03 |
| 1.05e+06 | 8.06e-03 | 5.95e-03 | 8.49e-03 | 9.91e-03 |
plt_lds_comp(df_s,'Sobol',['r','g','b','c','m']) # GC = GrayCode, N=Natural
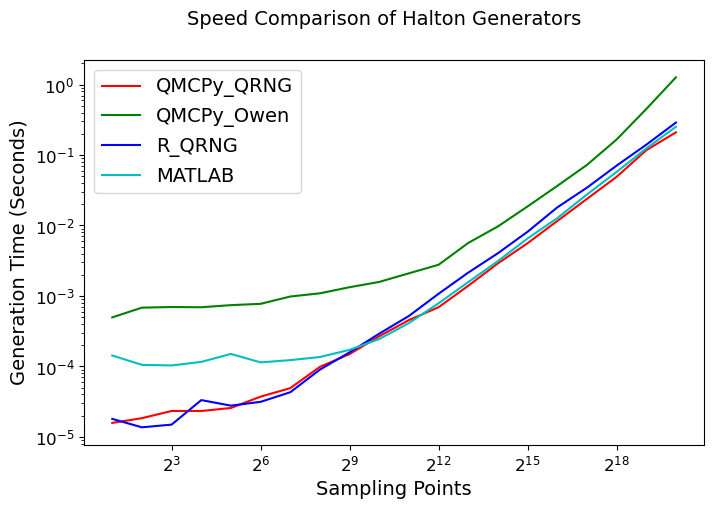
Halton (Generalized)
df_h = pd.concat([df_py['n'], df_py['py_h_QRNG'],df_py['py_h_Owen'], df_r['r_h'],df_m['m_h']], axis=1)
df_h.columns = ['N','QMCPy_QRNG','QMCPy_Owen','R_QRNG','MATLAB']
df_h.set_index('N')
| QMCPy_QRNG | QMCPy_Owen | R_QRNG | MATLAB | |
|---|---|---|---|---|
| N | ||||
| 2.00e+00 | 1.58e-05 | 4.96e-04 | 1.80e-05 | 1.43e-04 |
| 4.00e+00 | 1.84e-05 | 6.82e-04 | 1.36e-05 | 1.05e-04 |
| 8.00e+00 | 2.33e-05 | 6.96e-04 | 1.49e-05 | 1.03e-04 |
| 1.60e+01 | 2.33e-05 | 6.91e-04 | 3.32e-05 | 1.16e-04 |
| 3.20e+01 | 2.57e-05 | 7.40e-04 | 2.77e-05 | 1.50e-04 |
| 6.40e+01 | 3.72e-05 | 7.73e-04 | 3.14e-05 | 1.14e-04 |
| 1.28e+02 | 4.91e-05 | 9.81e-04 | 4.30e-05 | 1.23e-04 |
| 2.56e+02 | 9.86e-05 | 1.09e-03 | 9.00e-05 | 1.36e-04 |
| 5.12e+02 | 1.49e-04 | 1.33e-03 | 1.59e-04 | 1.72e-04 |
| 1.02e+03 | 2.68e-04 | 1.58e-03 | 2.91e-04 | 2.45e-04 |
| 2.05e+03 | 4.54e-04 | 2.10e-03 | 5.20e-04 | 4.12e-04 |
| 4.10e+03 | 6.92e-04 | 2.77e-03 | 1.07e-03 | 7.87e-04 |
| 8.19e+03 | 1.39e-03 | 5.65e-03 | 2.14e-03 | 1.57e-03 |
| 1.64e+04 | 2.90e-03 | 9.70e-03 | 4.04e-03 | 3.13e-03 |
| 3.28e+04 | 5.61e-03 | 1.86e-02 | 8.15e-03 | 6.55e-03 |
| 6.55e+04 | 1.16e-02 | 3.64e-02 | 1.81e-02 | 1.27e-02 |
| 1.31e+05 | 2.39e-02 | 7.24e-02 | 3.44e-02 | 2.75e-02 |
| 2.62e+05 | 4.90e-02 | 1.66e-01 | 7.07e-02 | 5.76e-02 |
| 5.24e+05 | 1.17e-01 | 4.50e-01 | 1.40e-01 | 1.24e-01 |
| 1.05e+06 | 2.10e-01 | 1.27e+00 | 2.89e-01 | 2.52e-01 |
plt_lds_comp(df_h,'Halton',colors=['r','g','b','c'])
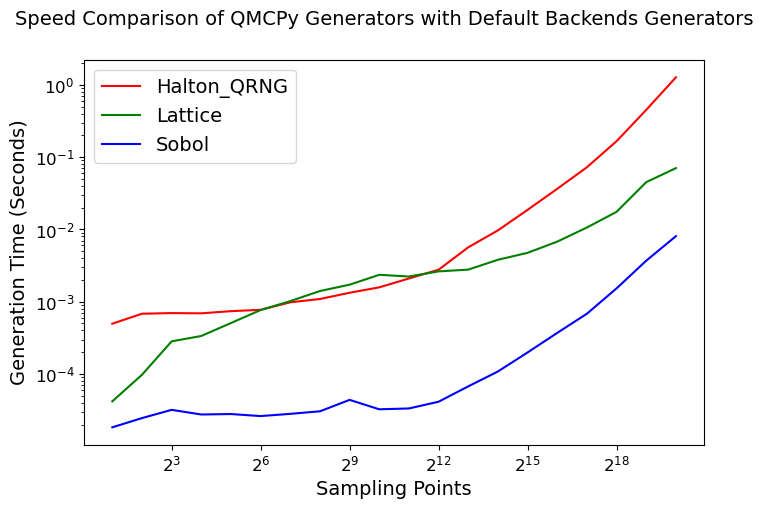
QMCPy Default Generators
df_qmcpy = pd.concat([df_py['n'], df_py['py_h_Owen'], df_py['py_n'], df_py['py_s_QMCPy']], axis=1)
df_qmcpy.columns = ['N','Halton_QRNG', 'Lattice', 'Sobol']
df_qmcpy.set_index('N')
| Halton_QRNG | Lattice | Sobol | |
|---|---|---|---|
| N | |||
| 2.00e+00 | 4.96e-04 | 4.19e-05 | 1.83e-05 |
| 4.00e+00 | 6.82e-04 | 9.76e-05 | 2.46e-05 |
| 8.00e+00 | 6.96e-04 | 2.83e-04 | 3.20e-05 |
| 1.60e+01 | 6.91e-04 | 3.36e-04 | 2.76e-05 |
| 3.20e+01 | 7.40e-04 | 5.07e-04 | 2.80e-05 |
| 6.40e+01 | 7.73e-04 | 7.67e-04 | 2.62e-05 |
| 1.28e+02 | 9.81e-04 | 1.02e-03 | 2.81e-05 |
| 2.56e+02 | 1.09e-03 | 1.41e-03 | 3.05e-05 |
| 5.12e+02 | 1.33e-03 | 1.72e-03 | 4.39e-05 |
| 1.02e+03 | 1.58e-03 | 2.36e-03 | 3.25e-05 |
| 2.05e+03 | 2.10e-03 | 2.23e-03 | 3.34e-05 |
| 4.10e+03 | 2.77e-03 | 2.63e-03 | 4.14e-05 |
| 8.19e+03 | 5.65e-03 | 2.78e-03 | 6.76e-05 |
| 1.64e+04 | 9.70e-03 | 3.80e-03 | 1.08e-04 |
| 3.28e+04 | 1.86e-02 | 4.74e-03 | 1.99e-04 |
| 6.55e+04 | 3.64e-02 | 6.78e-03 | 3.71e-04 |
| 1.31e+05 | 7.24e-02 | 1.06e-02 | 6.82e-04 |
| 2.62e+05 | 1.66e-01 | 1.75e-02 | 1.53e-03 |
| 5.24e+05 | 4.50e-01 | 4.51e-02 | 3.70e-03 |
| 1.05e+06 | 1.27e+00 | 7.04e-02 | 8.06e-03 |
plt_lds_comp(df_qmcpy,'QMCPy Generators with Default Backends',colors=['r','g','b','c'])